📊 RSI- Basic concepts and QA
1. What is the RSI indicator?
✅ The Relative Strength Index (RSI) is a momentum oscillator that measures the speed and change of price movements. It ranges from 0 to 100 and is used to identify overbought or oversold conditions.
2. Who developed the RSI indicator?
✅ RSI was developed by J. Welles Wilder and introduced in his 1978 book 'New Concepts in Technical Trading Systems'.
3. How is RSI calculated?
✅ RSI is calculated using the average gains and losses over a specific period, typically 14 days. The formula transforms this into a value between 0 and 100.
4. What does RSI below 30 mean?
✅ An RSI below 30 typically indicates that a stock is oversold. Traders may interpret this as a potential buying opportunity.
5. What does RSI above 70 mean?
✅ An RSI above 70 suggests that a stock is overbought. This may signal that a price reversal or pullback is likely.
6. Why use RSI in trading?
✅ RSI helps traders identify entry and exit points by indicating momentum. It works well with other indicators and is used in both intraday and long-term analysis.
7. What is the standard period for RSI?
✅ The default RSI period is 14, but traders may adjust this based on their trading strategy or timeframe.
8. Can RSI be used for all assets?
✅ Yes, RSI can be applied to stocks, forex, commodities, and cryptocurrencies, making it a versatile tool.
9. How does RSI indicate divergence?
✅ RSI divergence occurs when the price moves in the opposite direction of the RSI, signaling potential reversals.
10. What is RSI failure swing?
✅ Failure swings are RSI movements that reverse direction without crossing overbought or oversold thresholds, indicating potential trend changes.
11. How is RSI different from MACD?
✅ While RSI measures momentum, MACD indicates trend direction and strength. They can be used together for confirmation.
12. What are RSI bullish and bearish divergences?
✅ Bullish divergence is when RSI rises while price falls, and bearish divergence is when RSI falls while price rises.
13. Can RSI be used in range-bound markets?
✅ Yes, RSI is especially useful in sideways markets to identify overbought and oversold zones.
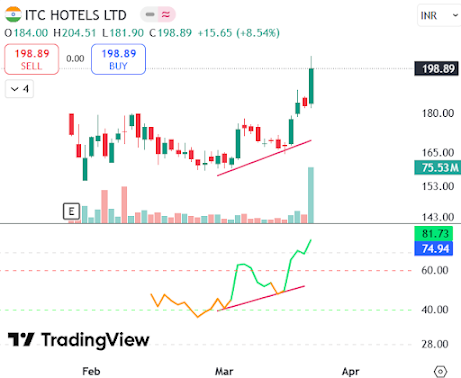
14. What is the RSI trendline strategy?
✅ Drawing trendlines on RSI can help identify breakouts even before price confirms the move.
15. Is RSI useful for intraday trading?
✅ Yes, RSI is popular among intraday traders for spotting quick reversals and momentum shifts.
16. Can RSI give false signals?
✅ Like all indicators, RSI can produce false signals. It's best used with confirmation from volume or chart patterns.
17. What are the limitations of RSI?
✅ RSI may lag during strong trends, giving early or late signals. Combining it with other tools improves accuracy.
18. What does RSI range shift mean?
✅ In a strong trend, RSI tends to stay in the upper or lower range instead of oscillating between 30 and 70.
19. What is a good RSI strategy for beginners?
✅ Look for RSI crossovers at 30 or 70 combined with candlestick patterns or support/resistance zones.
20. How do professionals use RSI?
✅ Professionals use RSI with other indicators like Bollinger Bands and trendlines to increase probability of success.
21. Can RSI be customized?
✅ Yes, traders often change the period length or levels (e.g., 20/80 instead of 30/70) based on their approach.
22. How to use RSI on TradingView?
✅ Search for RSI in the indicator list and apply it to any chart. You can adjust settings and overlay it with other tools.
23. Where to learn more about RSI?
✅ Check this in-depth article on Best Trading Indicators: Complete Analysis.
24. What timeframe is best for RSI?
✅ RSI works on all timeframes. For intraday use shorter periods like 5 or 9, and for long-term use 14 or 21.
25. How does RSI relate to price action?
✅ RSI reflects price momentum and can confirm or warn against price action setups like breakouts or pullbacks.
🛒 Recommended Trading Setup
Before you dive into daily trading or long-term investing, make sure your trading desk setup is supportive and efficient. A solid physical setup improves your focus, reduces fatigue, and can directly impact your results.
Here’s a handpicked list of affordable, high-quality tools and furniture to boost your trading performance: